
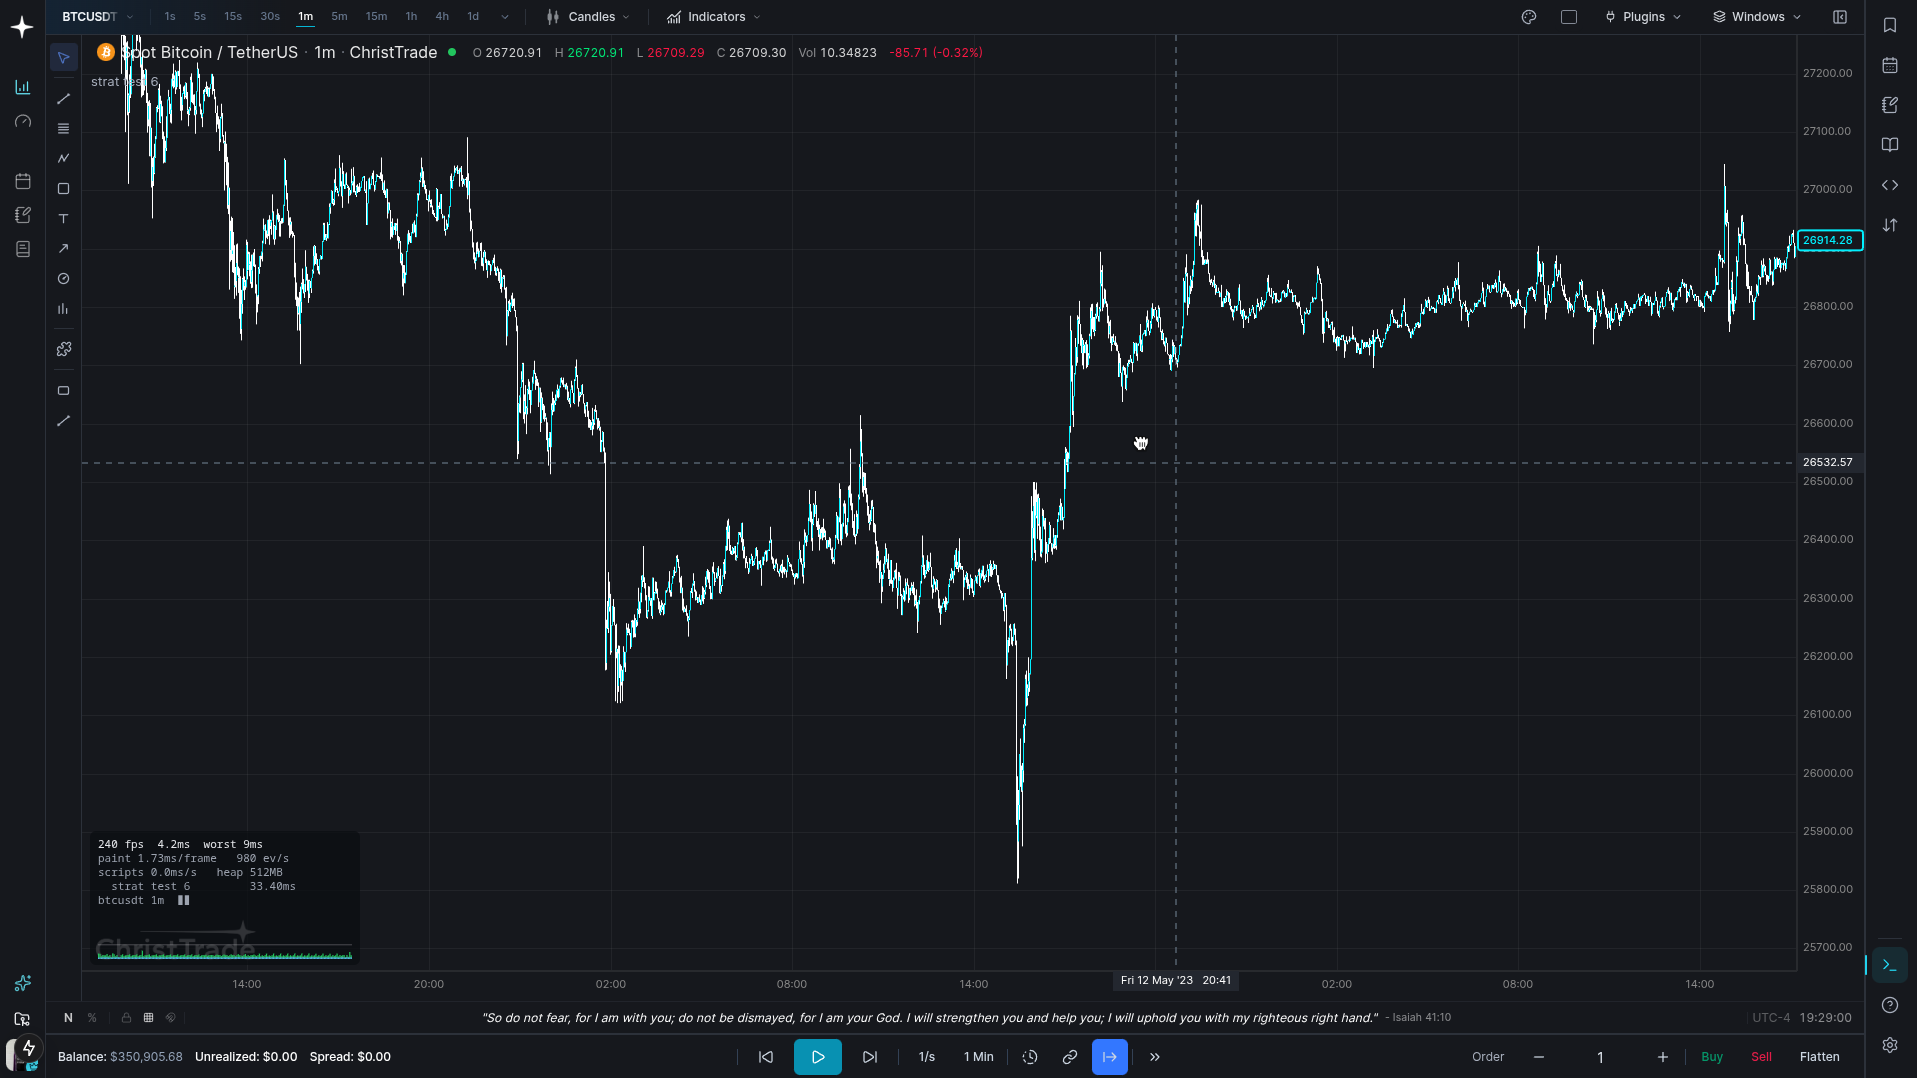
Like the new look? Look I can add images and shit now
Anyways, lets get to the point:
FPS at 1M bars
240
from 55
Frame time
4.3ms
from 13ms
JS heap
619 MB
from 1.9 GB
This was taken on the same 1m BTC chart (dev mode) with the same 1 million loaded bars. Before was Depth 0.19, after is Depth 0.20
So what was the problem
Panning back on the chart to load historical data obviously loaded the bars into memory which added up quickly, and at about a million loaded bars, panning got so slow that it ran between like 50-60 fps, from 240+ at start... Not even mentioning the ram usage
Why it was slow
The main issues causing this horrendous lag was not the panning logic, but surprisingly the status line, drawing magnet snap, and the y-axis autofit. They all looped over every loaded bar - the status line on every mouse move, magnet snap on every mouse move while drawing, and autofit every time it fit the y-axis. At 1k loaded bars, its no problem at all, but at a million, thats 1 million bars looped on every mouse move event. The status line being extra bad since it copied all the bars twice and then filtered to find the hovered bar.
The fix
The fix was super easy. Since bars are sorted by time, the obvious answer was to just use a binary search which halves the range each step. Means about 20 steps to find the bar under the cursor instead of 1 million. And autofit just stopped copying everything first.
0.19.0
0.20.0
Then the memory
Pre 0.20, every bar was a JS Object, making it around 176 bytes, and there were 3+ copies of the bars arrays around too. Now there's just one shared set of typed array columns that every chart shares, shrinking the size down to 48 bytes per bar!
0.19.0
0.20.0
How I knew nothing broke
Changing how data is represented at the ground is bound to come with bugs and issues. So what I did to prove that everything was fine was to run the old version and the new one side by side, give them the same random inputs and compare everything they output with a fake canvas that records every draw call. 5820 render cases and 6171 matching-engine fills later, all identical, proves nothing changed :) I did find a couple bugs that were already there tho so not complaining about that
Keeping it fast
The maintenance part. how do I make sure that the charts stay fast? First thing to come to mind was some sort of guard in CI so that if it ever got slow again, CI goes red and I can't miss it. How it works is it just times everything at 20k and 1M bars, fails if anything is 5x slower at 1M. It checks memory too, a bar can't take more than 72 bytes. Left is 20k bars, right is 1M, last number is how many times slower:
ok   draw candles   118.0µs -> 85.4µs  0.7x
ok   status line    0.8µs -> 0.9µs  1.1x
ok   autofit        2.0µs -> 1.9µs  1.0x
ok   magnet snap    1.0µs -> 0.9µs  0.9x
ok   page prepend   0.96ms -> 1.04ms  1.1x
ok bytes/bar 66.7 at 1M, spare room included (max 72)It's out in Depth 0.20! Check out the changelog